
Accounting & SaaS KPIs
Accounting reports are designed to support financial reporting and reconciliation workflows.
- ARR/MRR Report* - This reviews recurring revenue and trends over different periods of time, whether monthly (MRR), quarterly (QRR), or annually (ARR).
*This merges the previous Month-End Report with the previous Recurring Revenue Report.
- NRR/GRR Report - Measure customer revenue retention performance for two things: 1) Net Revenue Retention (NRR) and Gross Revenue Retention (GRR)
- Revenue Analysis Report - Analyze recognized revenue across customers and time periods.
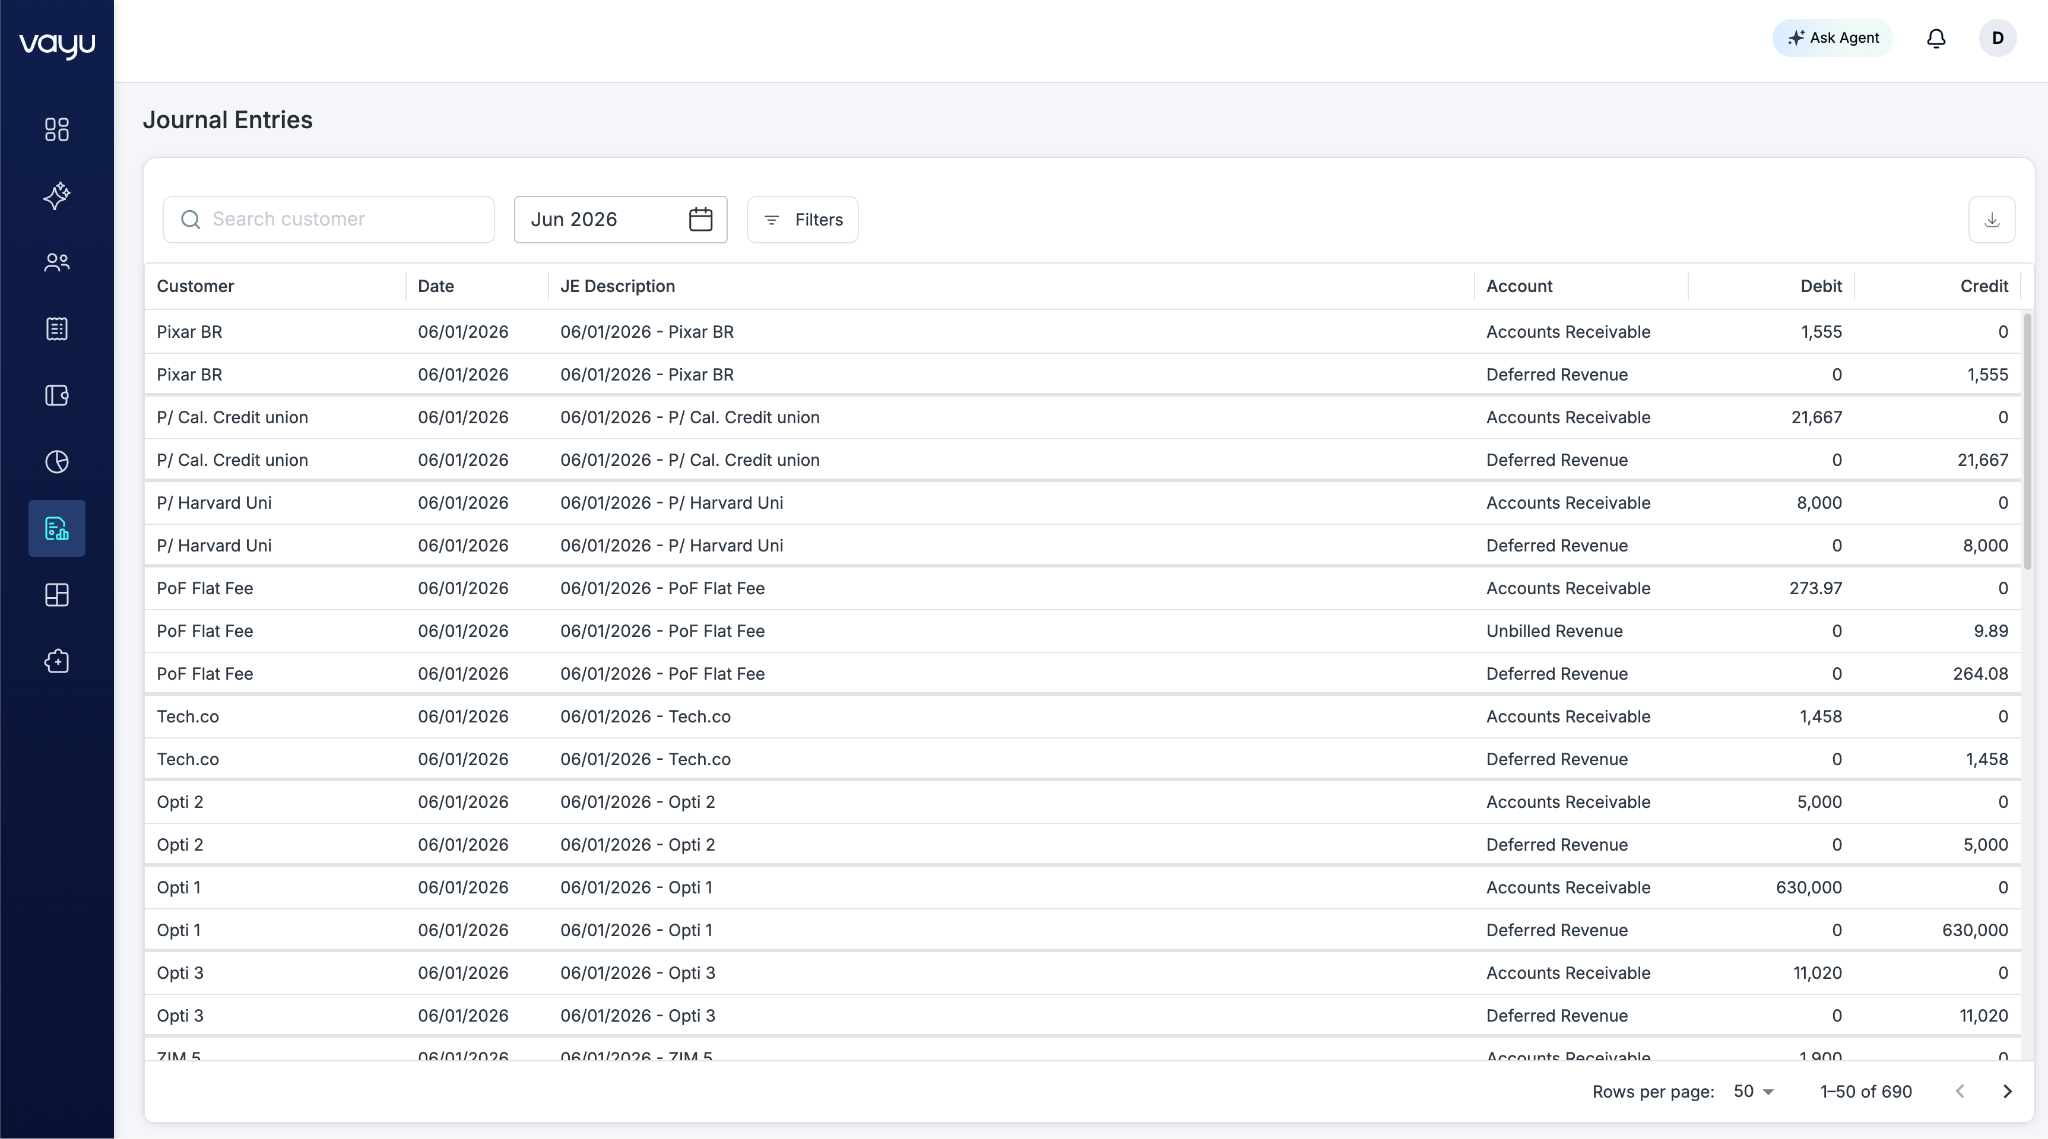
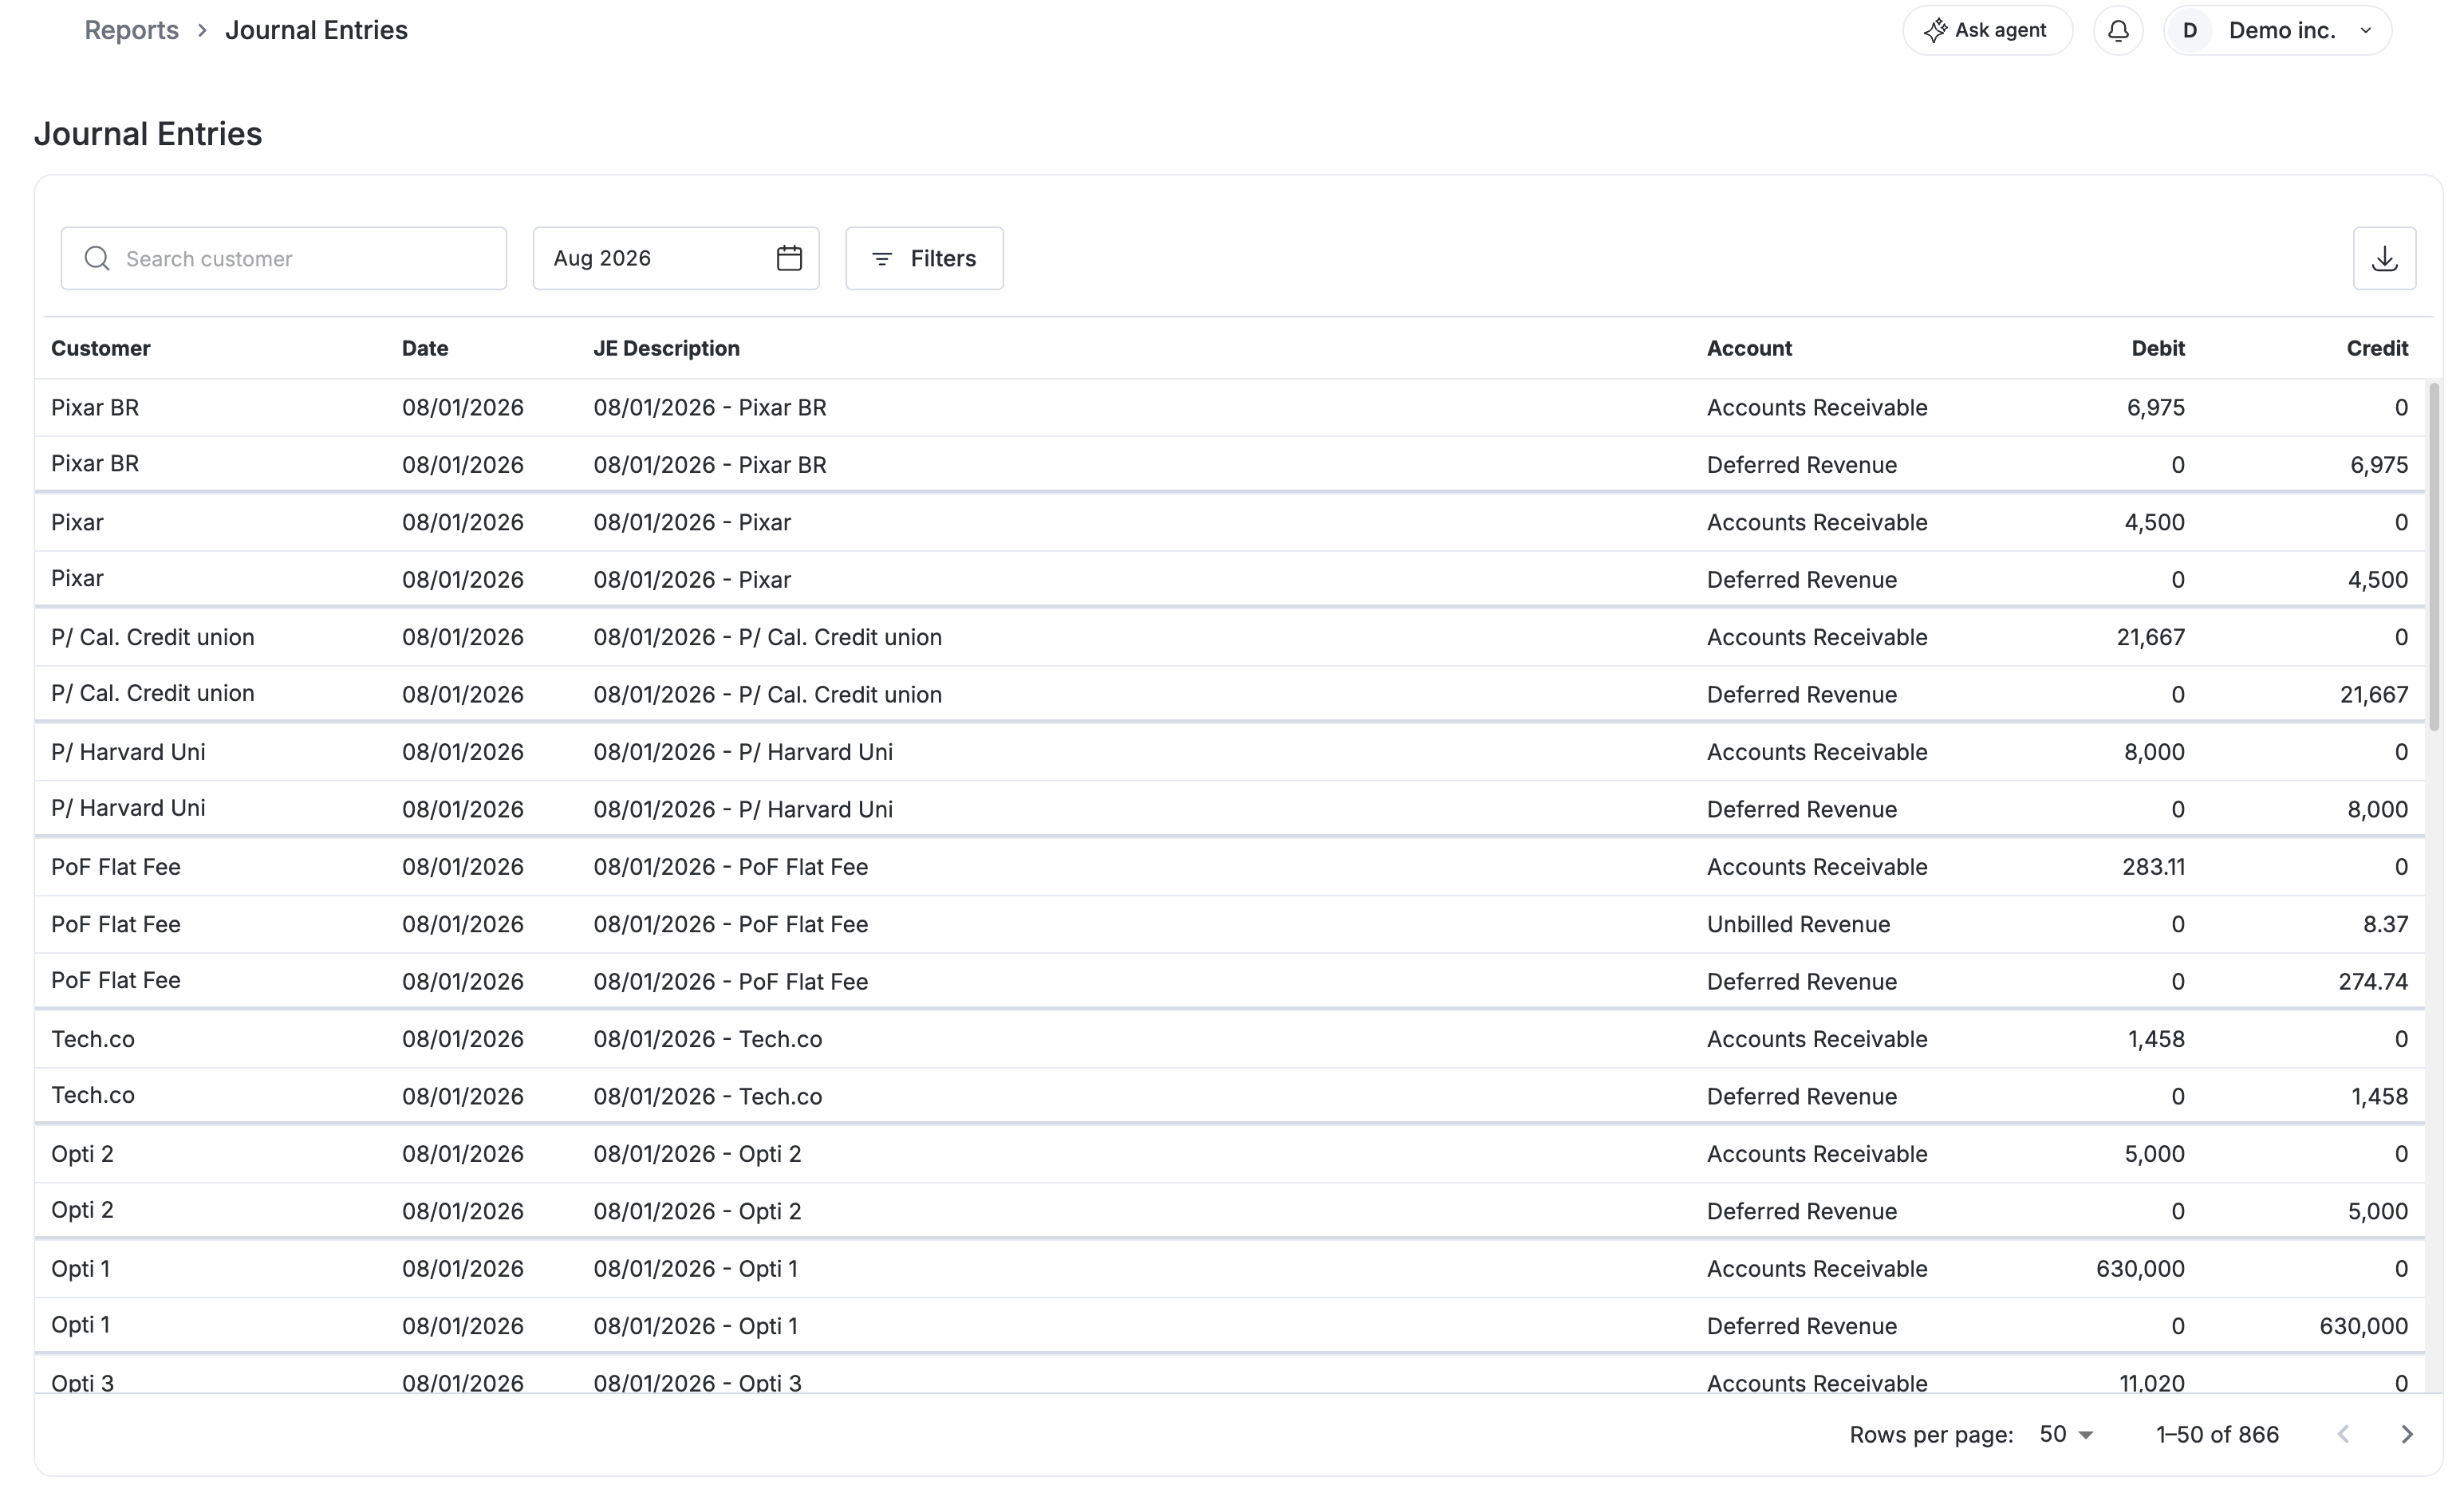
- Journal Entries - Review debit and credit records for every transaction movement in your account.
Accounting reports are designed to support financial reporting and reconciliation workflows. These reports provide the data needed to close books, recognize revenue, and maintain compliance with accounting standards.
ARR / MRR Report
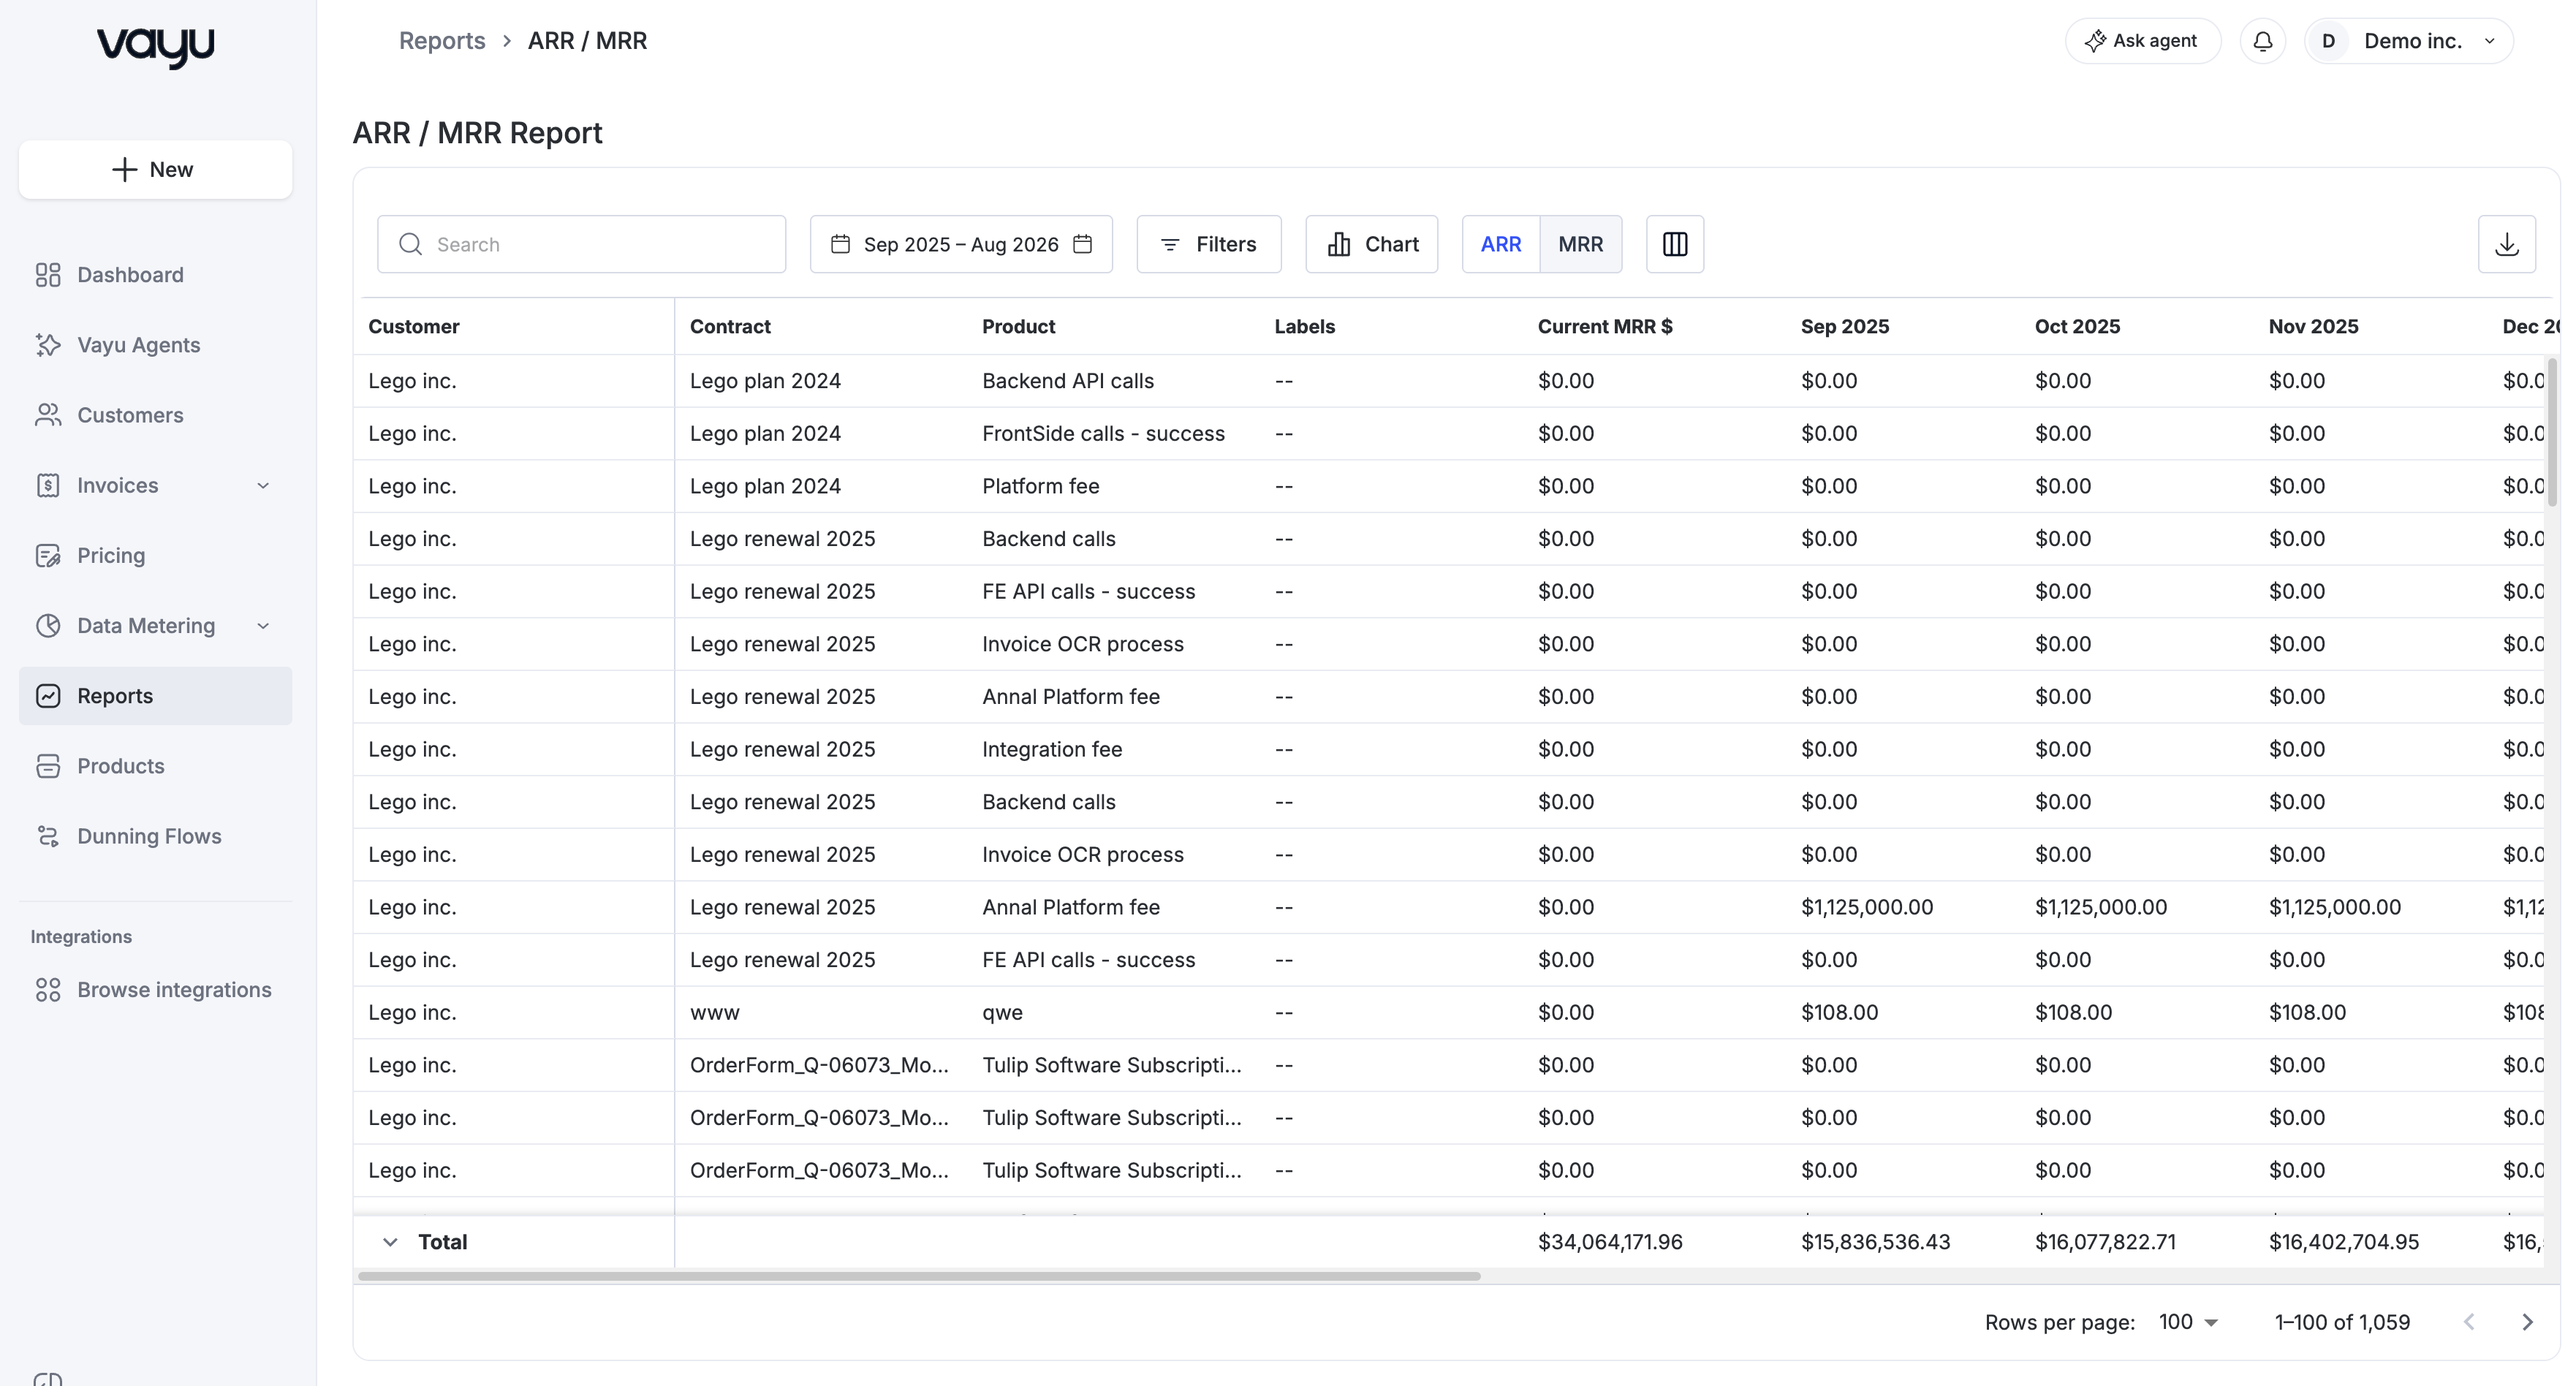
The ARR / MRR Report tracks recurring revenue trends over time across customers, contracts, products, and billing periods. This report calculates MRR (Monthly Recurring Revenue), QRR (Quarterly Recurring Revenue), and ARR (Annual Recurring Revenue) using active recurring contract data and displays both current revenue values and historical changes.
Users can now use the toggle on the report to switch their view between a monthly breakdown of MRR (Monthly Recurring Revenue) or ARR (Annual Recurring Revenue).
It includes the following metrics:
- Current MRR values by customer and contract
- Historical MRR, QRR, and ARR trends across selected time periods
- Revenue waterfall movements, including:
- New revenue
- Expansion revenue
- Reactivation revenue
- Contraction revenue
- Churned revenue
- Contract start and end dates
- Contract status information
- Revenue grouped by customer, contract, or product
- Original currency values and exchange rate conversions
- Custom fields and metadata for segmentation
- Monthly, quarterly, and annual reporting views
Recurring revenue is calculated using active recurring contract charges and billing schedules. The report includes recurring subscription and fixed-fee revenue while excluding one-time charges and non-recurring invoice items. Contract phase changes, renewals, expirations, uplifts, and pricing adjustments are reflected automatically in the calculation logic.
The chart view provides a recurring revenue waterfall visualization that highlights revenue movement between reporting periods. Revenue categories such as New, Expansion, Reactivation, Contraction, and Churn are displayed alongside total MRR trends to help explain period-over-period changes.
The report supports configurable dimensions and column selection, allowing users to customize views using customer attributes, labels, subsidiaries, contract metadata, currencies, and other available business fields.
Export/Download
You can download the report as a CSV for financial reporting, board reporting, forecasting, and revenue operations analysis.
Ask AI Agent
The ARR / MRR Report includes the Ask AI Agent, which allows users to analyze recurring revenue trends using natural-language questions. Users can quickly investigate churn, expansion, MRR waterfalls, product-level revenue breakdowns, and projected ARR without manually building filters or reports.
NRR / GRR Report
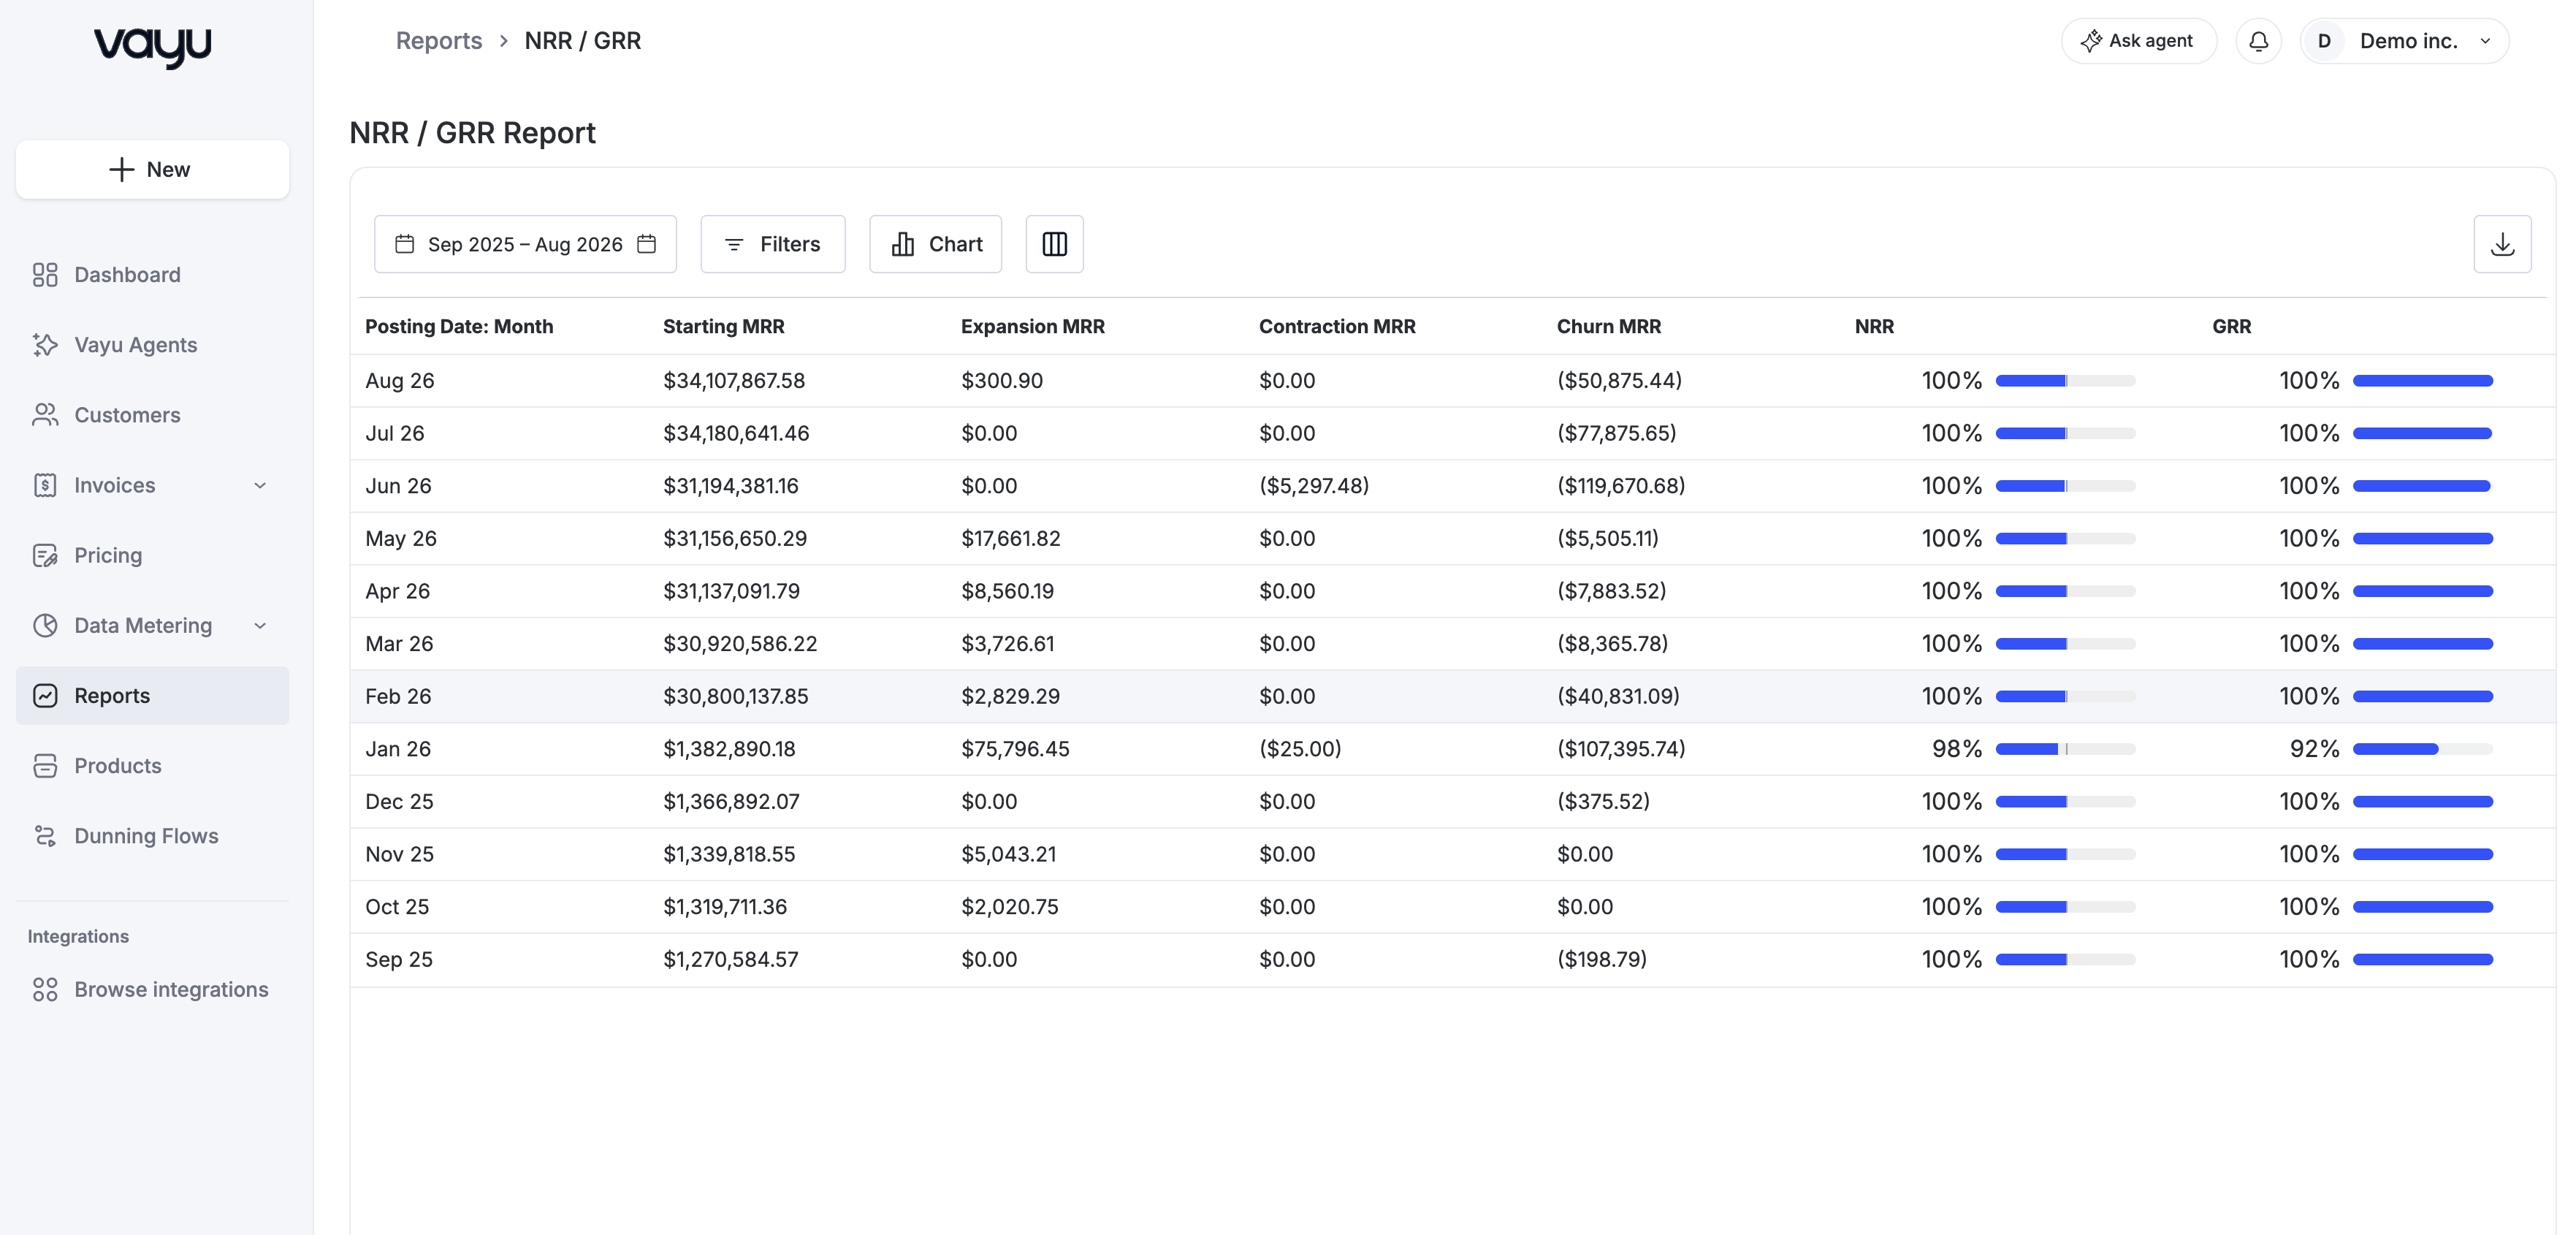
The NRR / GRR Report measures customer revenue retention over time by analyzing recurring revenue changes across existing customer accounts. This report calculates NRR (Net Revenue Retention) and GRR (Gross Revenue Retention) using recurring revenue activity such as expansions, contractions, and churn.
The report displays the following metrics:
- Starting MRR for each reporting period
- Expansion MRR from upgrades and account growth
- Contraction MRR from downgrades or reduced spend
- Churn MRR from fully lost recurring revenue
- NRR percentages by reporting period
- GRR percentages by reporting period
- Historical monthly retention trends
- Retention performance across selected date ranges
NRR calculations include expansion revenue, contraction revenue, and churned revenue to measure overall retained and expanded recurring revenue from existing customers. GRR calculations exclude expansion revenue and measure only retained recurring revenue after accounting for contraction and churn.
Retention calculations are based on recurring contract revenue and active customer billing activity during each reporting period. One-time charges and non-recurring invoice items are excluded from retention calculations.
The report supports both chart and table views for analyzing retention performance at a high level or reviewing detailed monthly retention metrics.
The chart view visualizes retention trends over time and compares NRR and GRR performance across reporting periods. This makes it easier to identify periods of strong expansion, elevated churn, or declining customer retention.
Export/Download
You can download the report as a CSV for board reporting, investor reporting, revenue operations analysis, and customer retention monitoring.
Ask AI Agent
The NRR / GRR Report includes the Ask AI Agent for conversational retention analysis. Users can ask questions about NRR and GRR performance, identify customer contractions or expansions, and review retention trends across reporting periods directly from the report interface.
Revenue Analysis Report
The Revenue Analysis Report provides visibility into recognized, deferred, and unbilled revenue across customers, contracts, and adjustable reporting periods. This report shows finance and revenue teams how billed and unbilled revenue changes over time, monitor deferred balances, and recognize trends.
The report combines chart and table views to support both high-level financial analysis and detailed customer-level revenue review. It displays the following metrics:
- Recognized revenue by reporting period
- Deferred revenue balances over time
- Unbilled revenue amounts
- Revenue by customer and contract
- Monthly, quarterly, and annual revenue trends
- Remaining deferred balances by customer
- Historical revenue recognition activity
- Revenue totals across selected date ranges
The table view can be adjusted to give even more granular detail by adjusting metrics that appear on the table. It provides customer-level revenue detail, including monthly recognized revenue values, cumulative recognized totals, and remaining balances associated with active contracts and schedules.
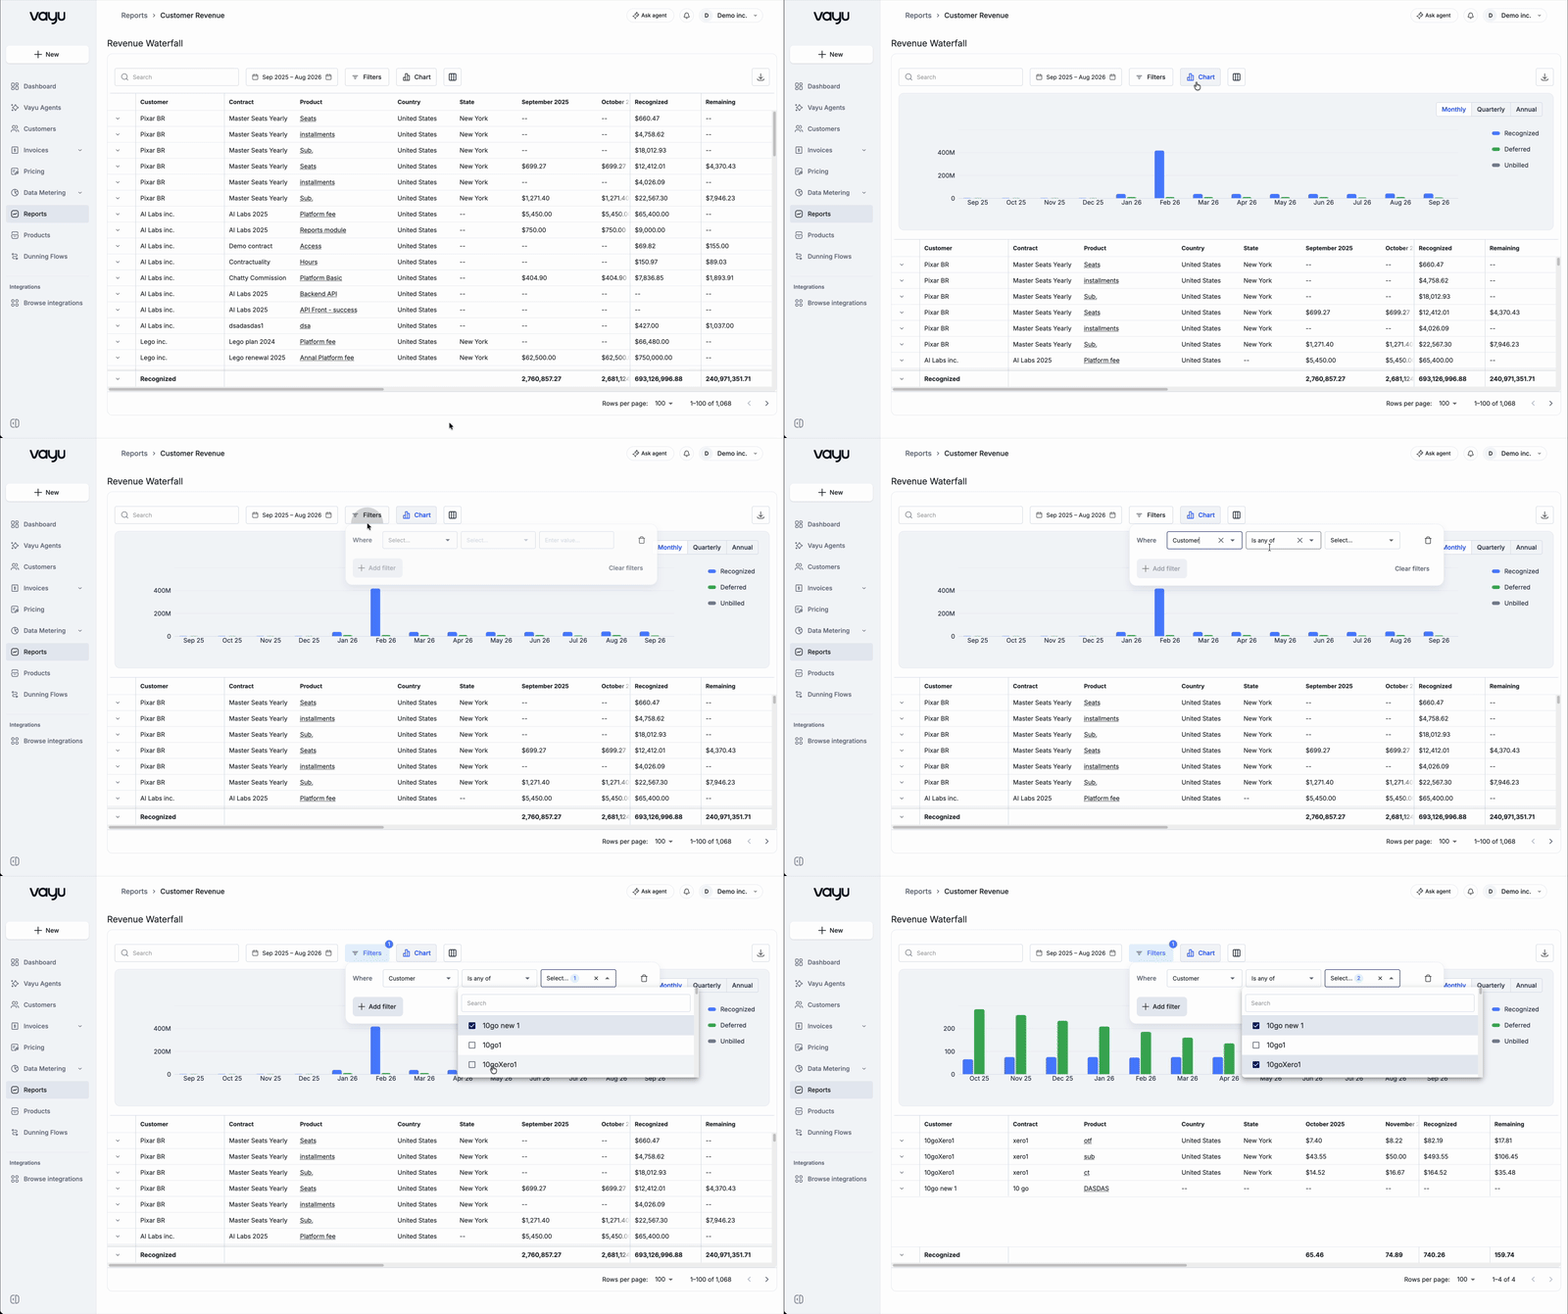
Revenue calculations are based on active billing schedules, invoice timing, contract structures, and revenue recognition rules configured within the platform. Recognized revenue reflects revenue earned during each reporting period, while deferred revenue represents billed revenue that has not yet been recognized. Unbilled revenue represents earned or scheduled revenue that has not yet been invoiced.
The chart view visualizes recognized, deferred, and unbilled revenue trends across adjustable time periods, making it easier to identify revenue timing shifts or changes in billing patterns.
Export/Download
You can download the report as a CSV for accounting review, financial reporting, revenue reconciliation, audit preparation, and operational analysis.
Ask AI Agent
The Revenue Analysis Report includes the Ask AI Agent for interactive revenue analysis and financial insights. Users can generate revenue summaries, identify concentration risks, analyze customer revenue distribution, and break down recognized revenue trends using natural-language queries.
Journal Entries
The Journal Entries report provides a detailed view of accounting entries generated for your customers. Each row shows the customer, entry date, journal entry description, associated account, and the corresponding debit or credit amount.
Use the customer search, month selector, and Filters to narrow the report by description, account, debit, or credit values. You can also download the report using the download button in the upper-right corner.
Journal entries are grouped by transaction, making it easy to see how amounts are distributed across accounts such as Accounts Receivable, Deferred Revenue, and Unbilled Revenue.